Around May, I started thinking about what my first year at iF Returns actually looked like. My CTO Paul was telling me in a huddle that we rarely take time to look back at what we’ve done. So I started an Astro project and planning the wrapped.
I wanted to show it the way Spotify Wrapped shows your listening history: no narrative spin, just the receipts. I also saw one Anthropic Engineer analyzing his iMessage message history with his fiancée and analyzed it with Claude.
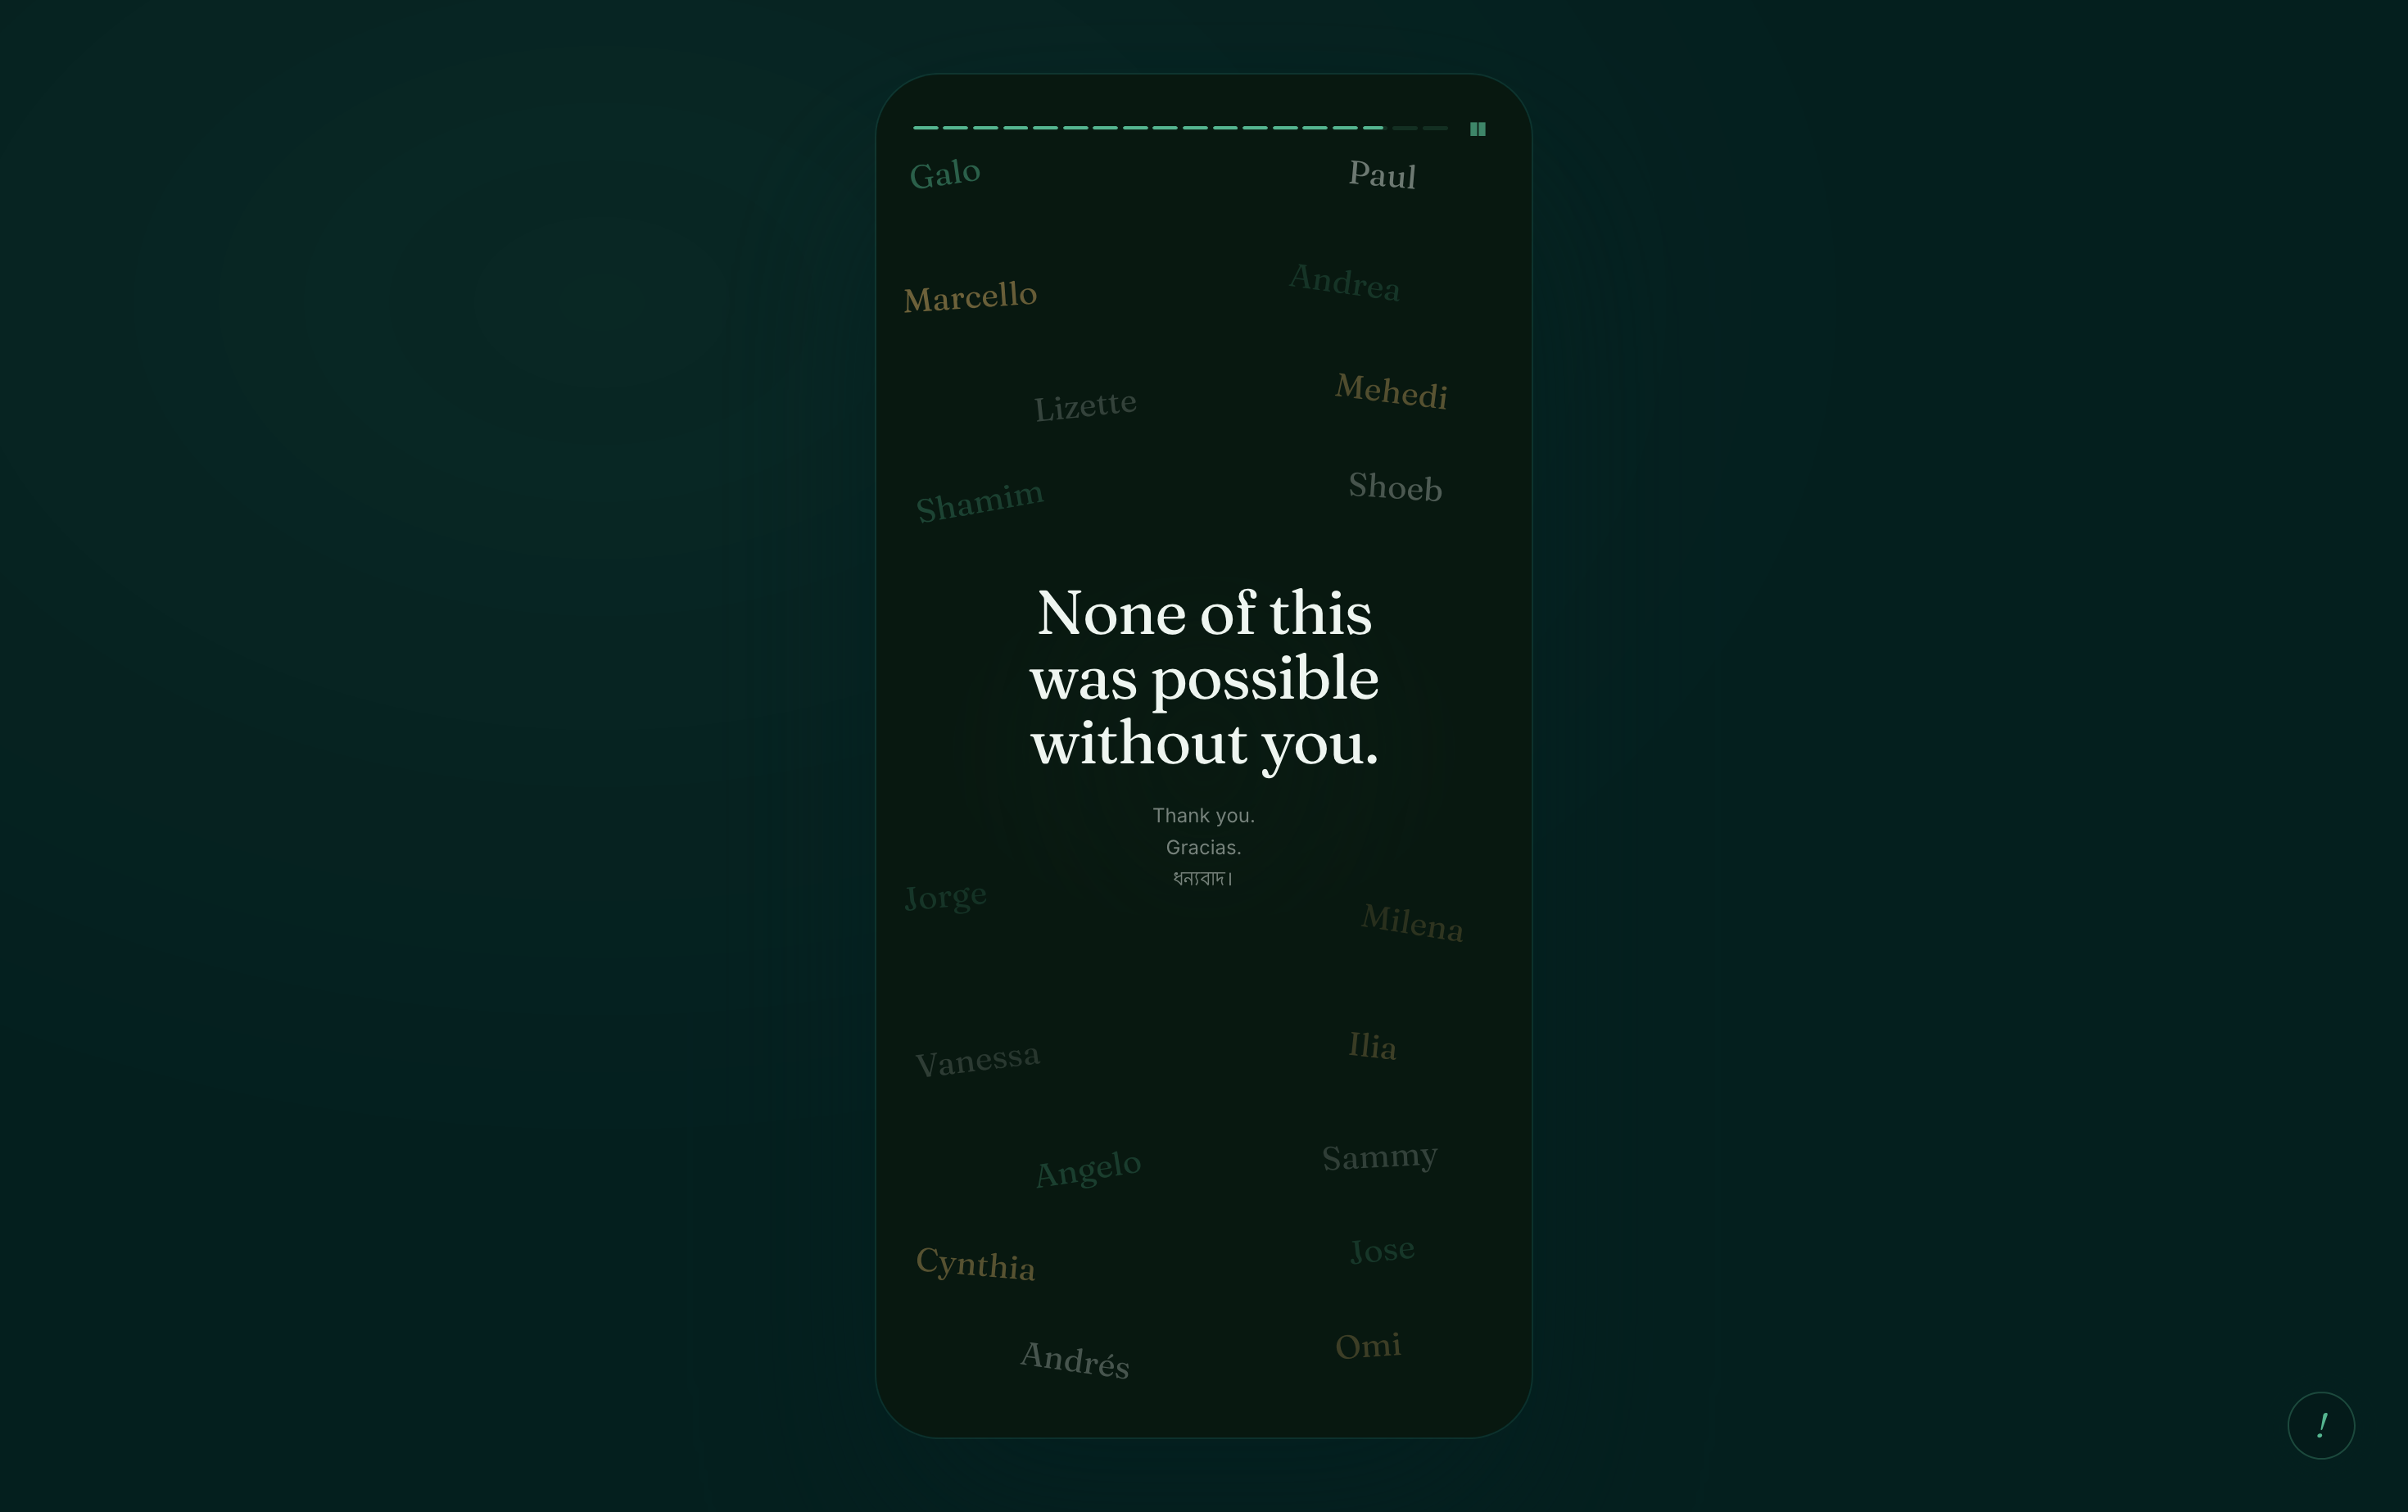
So, I realized I should do something similar, with an Instagram-style story presentation that runs through all counts of commits, merge requests, when during the day I was most active, merchant outcomes, platform work, a team tribute at the end. All backed by real numbers I actually went and found.
I ran git log across all my work repos. Hit the GitLab API for merge request counts. Exported my Slack history and wrote a small script to find when I was most active. Then ran SQL queries against production databases for anything touching merchant outcomes. The slide showing Desigual had a 192,000 order logistics footprint? I ran that query three times. The number looked wrong until it didn't.
Every slide has a small "!" button. Click it and you get a panel with the exact SQL or API call behind whatever number is on screen. I built that because I was nervous people would think I inflated the stats. Turns out I'm just the kind of person who attaches sources to personal projects.
Picking what to actually say on each slide was the part that took the most time. The commit activity chart peaks at 10pm. That's real. I work best after midnight when there are no meetings and Slack goes quiet. I decided to put that on the slide as a personality trait rather than something to explain away.
The merchant slides were the ones I cared about most. iF Returns handles returns and logistics for brands across Europe, so most of my work didn't have a visible surface. It showed up in production data: exchange orders created, credits resolved, return IDs populated across 17,906 orders at 99.5% coverage.
That's what actually shipped. I wanted to make that visible instead of saying "I worked on the exchange flow."
I sent the link to a few teammates on Monday morning after finishing the last slide. One of them said it made the year feel real in a way a summary doc never would.
Good enough. Visit it in ifreturns.errhythm.me.